Electricity cost optimization for enterprises

 18%




We help industrial enterprises, production sites and large consumers reduce electricity costs through technical and economic analysis, changes to supply terms, optimization of consumption patterns and modernization of power supply schemes.

Up to 30% savings on electricity

The gain from every solution in figures

Specialists with you at every stage
How an enterprise can cut its electricity costs
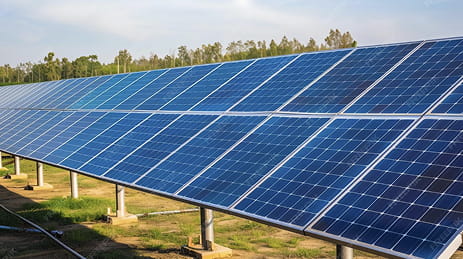
We select generating equipment by technical parameters to secure the optimal operating modes for the enterprise.

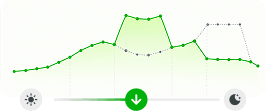
We draw up recommendations for adapting production processes in line with the analysis of hourly electricity prices and consumption volumes.

We assess the technical feasibility of changing the connection scheme to voltage class 1 and determine the potential economic effect.

We analyse the current electricity supply terms and recommend measures to secure group A metering, and select a supplier with the best commercial terms.
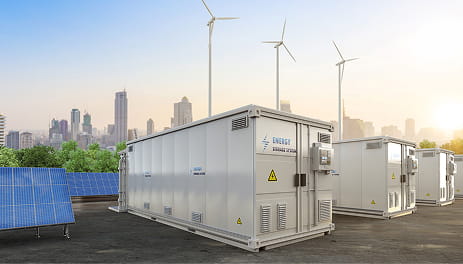
We develop the operating algorithm for the storage system to deliver the most efficient power consumption for the enterprise.
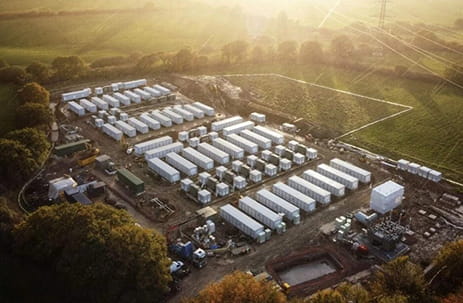
We carry out a comprehensive analysis of consumption volumes and prospective generation or storage, and determine the scope for additional profit from selling surplus electricity.
How we work
We study the cost structure of the enterprise, its consumption schedules, supply terms and connection parameters.
We build an individual strategy that sets out the technical and organizational measures required.
We determine CAPEX, the payback period, expected savings and key financial indicators.
Moving to a higher voltage class is one of the most effective optimization tools
- Connection to networks of 27.5 kV and above;
- Connection to power plant busbars;
- Lower electricity distribution tariffs.
- Connection to networks below 27.5 kV;
- Higher charges for distribution services.
We analyse whether the enterprise can technically move to a higher voltage class (above 27.5 kV), and assess the investment required and the projected economic effect.
Costs for consumed electricity are optimized by applying the appropriate tariff for electricity distribution services, which differs substantially between consumers of voltage classes 1 and 2.
For example, the electricity distribution tariff for legal entities of Vinnytsiaoblenergo JSC for:
For example, the electricity distribution tariff for legal entities of Vinnytsiaoblenergo JSC for:
- voltage class 1 — UAH 528.48/MWh excluding VAT
- voltage class 2 — UAH 2,921.68/MWh excluding VAT
The resulting saving comes to UAH 19.15 million a year for every 1 MWh of consumed capacity, with the enterprise running 8,000 hours a year.
Optimizing electricity consumption schedules
| Hour | 1 | 2 | 3 | 4 | 5 | 6 | 7 | 8 | 9 | 10 | 11 | 12 | 13 | 14 | 15 | 16 | 17 | 18 | 19 | 20 | 21 | 22 | 23 | 24 |
|---|---|---|---|---|---|---|---|---|---|---|---|---|---|---|---|---|---|---|---|---|---|---|---|---|
| January | 7 027 | 5 659 | 5 570 | 5 342 | 5 276 | 5 403 | 5 826 | 6 769 | 8 264 | 8 874 | 8 792 | 7 953 | 7 651 | 7 660 | 7 981 | 7 885 | 8 665 | 12 549 | 12 806 | 12 245 | 11 841 | 11 169 | 9 797 | 7 072 |
| February | 9 457 | 7 753 | 7 109 | 6 464 | 5 953 | 6 858 | 7 286 | 9 896 | 11 161 | 10 792 | 9 668 | 8 296 | 7 647 | 7 539 | 8 908 | 10 436 | 13 077 | 13 862 | 13 938 | 13 725 | 13 185 | 12 090 | 10 830 | 8 928 |
| March | 8 150 | 5 729 | 4 988 | 4 611 | 4 670 | 5 617 | 7 544 | 9 142 | 7 839 | 5 981 | 3 772 | 2 862 | 2 098 | 2 253 | 2 798 | 4 255 | 7 044 | 10 774 | 12 925 | 13 688 | 13 571 | 12 056 | 9 739 | 7 731 |
| April | 5 198 | 4 484 | 4 138 | 3 881 | 3 911 | 4 447 | 5 174 | 6 221 | 6 091 | 5 050 | 3 060 | 1 529 | 933 | 862 | 1 054 | 1 191 | 2 290 | 5 613 | 9 484 | 11 710 | 12 777 | 12 486 | 11 226 | 6 579 |
| May | 7 895 | 6 036 | 4 507 | 4 277 | 4 208 | 5 120 | 6 227 | 6 290 | 5 549 | 3 945 | 2 001 | 1 009 | 834 | 891 | 866 | 986 | 1 463 | 3 238 | 5 726 | 8 775 | 10 609 | 12 179 | 10 621 | 8 318 |
| June | 9 432 | 6 477 | 5 441 | 5 235 | 5 112 | 5 297 | 5 940 | 6 030 | 4 996 | 3 571 | 2 102 | 965 | 997 | 1 046 | 1 056 | 1 084 | 2 437 | 4 762 | 7 520 | 10 386 | 11 395 | 12 117 | 11 503 | 9 479 |
| July | 6 997 | 5 070 | 3 742 | 3 587 | 3 573 | 3 751 | 4 733 | 4 897 | 4 347 | 2 847 | 1 667 | 1 119 | 1 003 | 1 011 | 838 | 974 | 1 863 | 3 701 | 6 294 | 8 436 | 9 139 | 9 748 | 9 396 | 7 919 |
| August | 9 169 | 6 686 | 5 672 | 5 356 | 5 151 | 5 412 | 6 806 | 7 030 | 5 948 | 3 908 | 2 178 | 1 818 | 1 579 | 1 524 | 1 503 | 2 096 | 3 069 | 5 351 | 8 726 | 10 772 | 11 166 | 11 112 | 10 198 | 9 207 |
| September | 8 880 | 5 889 | 5 057 | 4 929 | 4 687 | 5 538 | 7 685 | 9 484 | 7 677 | 5 361 | 1 461 | 387 | 436 | 458 | 407 | 1 110 | 2 949 | 6 181 | 10 148 | 12 168 | 13 099 | 12 160 | 9 642 | 7 924 |
| October | 5 022 | 3 784 | 3 204 | 3 093 | 2 934 | 3 548 | 5 394 | 8 435 | 7 562 | 5 087 | 1 985 | 382 | 316 | 319 | 371 | 906 | 2 740 | 6 382 | 8 718 | 11 382 | 10 794 | 8 958 | 7 056 | 5 649 |
| November | 3 978 | 2 596 | 1 722 | 1 018 | 1 194 | 2 391 | 3 792 | 5 499 | 5 907 | 6 079 | 5 622 | 4 619 | 4 719 | 4 890 | 5 259 | 5 486 | 5 600 | 13 661 | 13 649 | 13 388 | 13 493 | 13 065 | 9 935 | 5 748 |
| December | 4 798 | 3 833 | 3 419 | 2 968 | 3 063 | 3 909 | 4 521 | 5 996 | 6 614 | 6 793 | 6 754 | 5 507 | 5 500 | 5 531 | 5 596 | 5 600 | 5 599 | 11 736 | 11 921 | 11 783 | 11 773 | 11 365 | 9 036 | 5 962 |
What the client gets

You see how much you can save each month and over the year.

You compare the options by implementation cost and expected savings.

You know the amount to invest and the projected time to recover it.

You have the priorities and the order of actions for implementing the chosen measures.
Optimize your electricity costs together with IKNET