

Interesting information for those who is interested in analytics and statistics. International organizations are watching closely what is going on in the world in the context of the implementation of alternative energy programs. First part. Second part here.
Based on the materials of site https://www.iea.org/publications/wei2017/
World Energy Investment 2017
Energy investment by sector
Total energy investment worldwide in 2016 was just over $1.7 trillion, accounting for 2.2% of global GDP. Investment was down by 12% compared to IEA’s revised 2015 energy investment estimate of $1.9 trillion.
Spending in energy efficiency rose by 9% while spending in electricity networks rose by 6%, yet these increases were more than offset by a continuing drop in investment in upstream oil and gas, which fell by over a quarter, and power generation, down 5%. Falling unit capital costs, especially in upstream oil and gas, and solar photovoltaics (PV), was a key reason for lower investment, though reduced drilling and less fossil fuel-based power capacity also contributed.
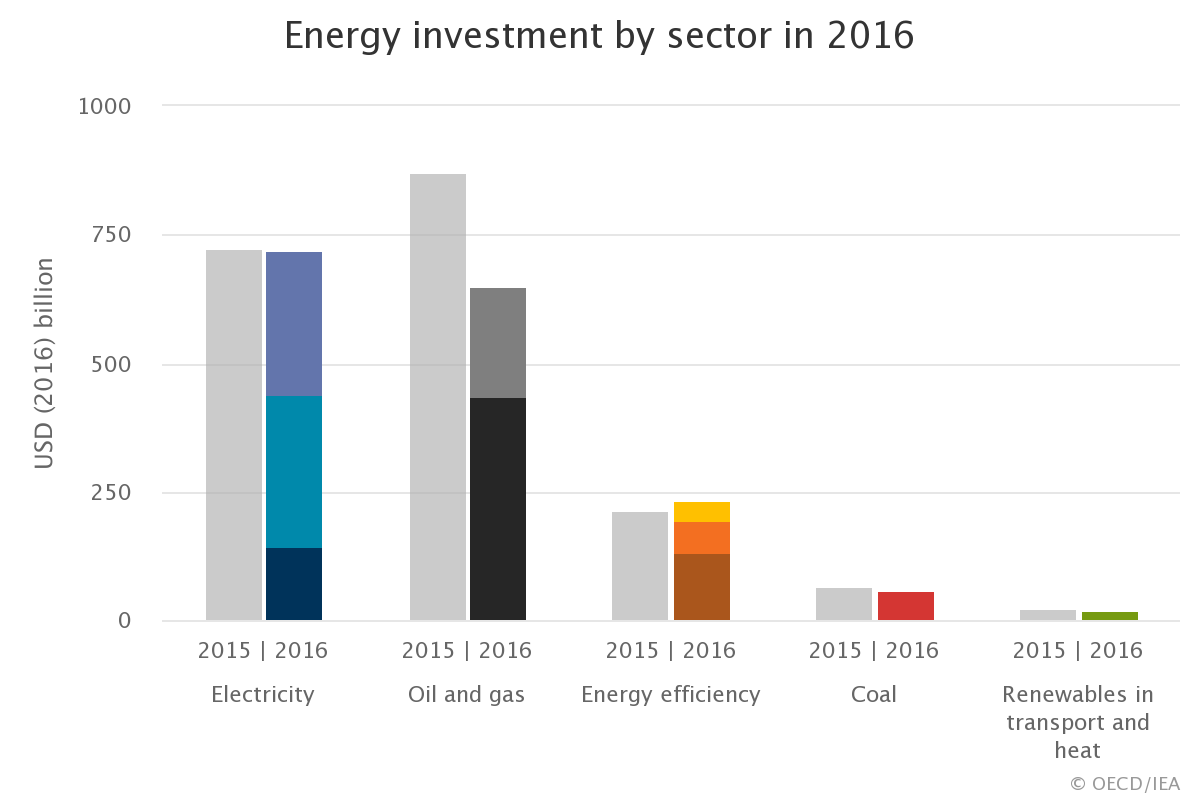
Fig.1 Energy investment by sector in 2016
For the first time ever, the electricity sector edged ahead of the oil and gas sector in 2016 to become the largest recipient of energy investment. However oil and gas still represent two-fifths of global energy supply investment, despite a fall of 38% in capital spending in that sector between 2014 and 2016. As a result, the share of low-carbon supply-side energy investments, including electricity networks, grew by six percentage points to 43% over the same period.
Regional trends in investment
China remained the largest destination of energy investment, taking 21% of the global total yet the makeup of investments in China has been changing. 2016 saw a 25% decline in commissioning of new coal-fired power plants. Today, energy investment in China is increasingly driven by low-carbon electricity supply and networks, and energy efficiency.
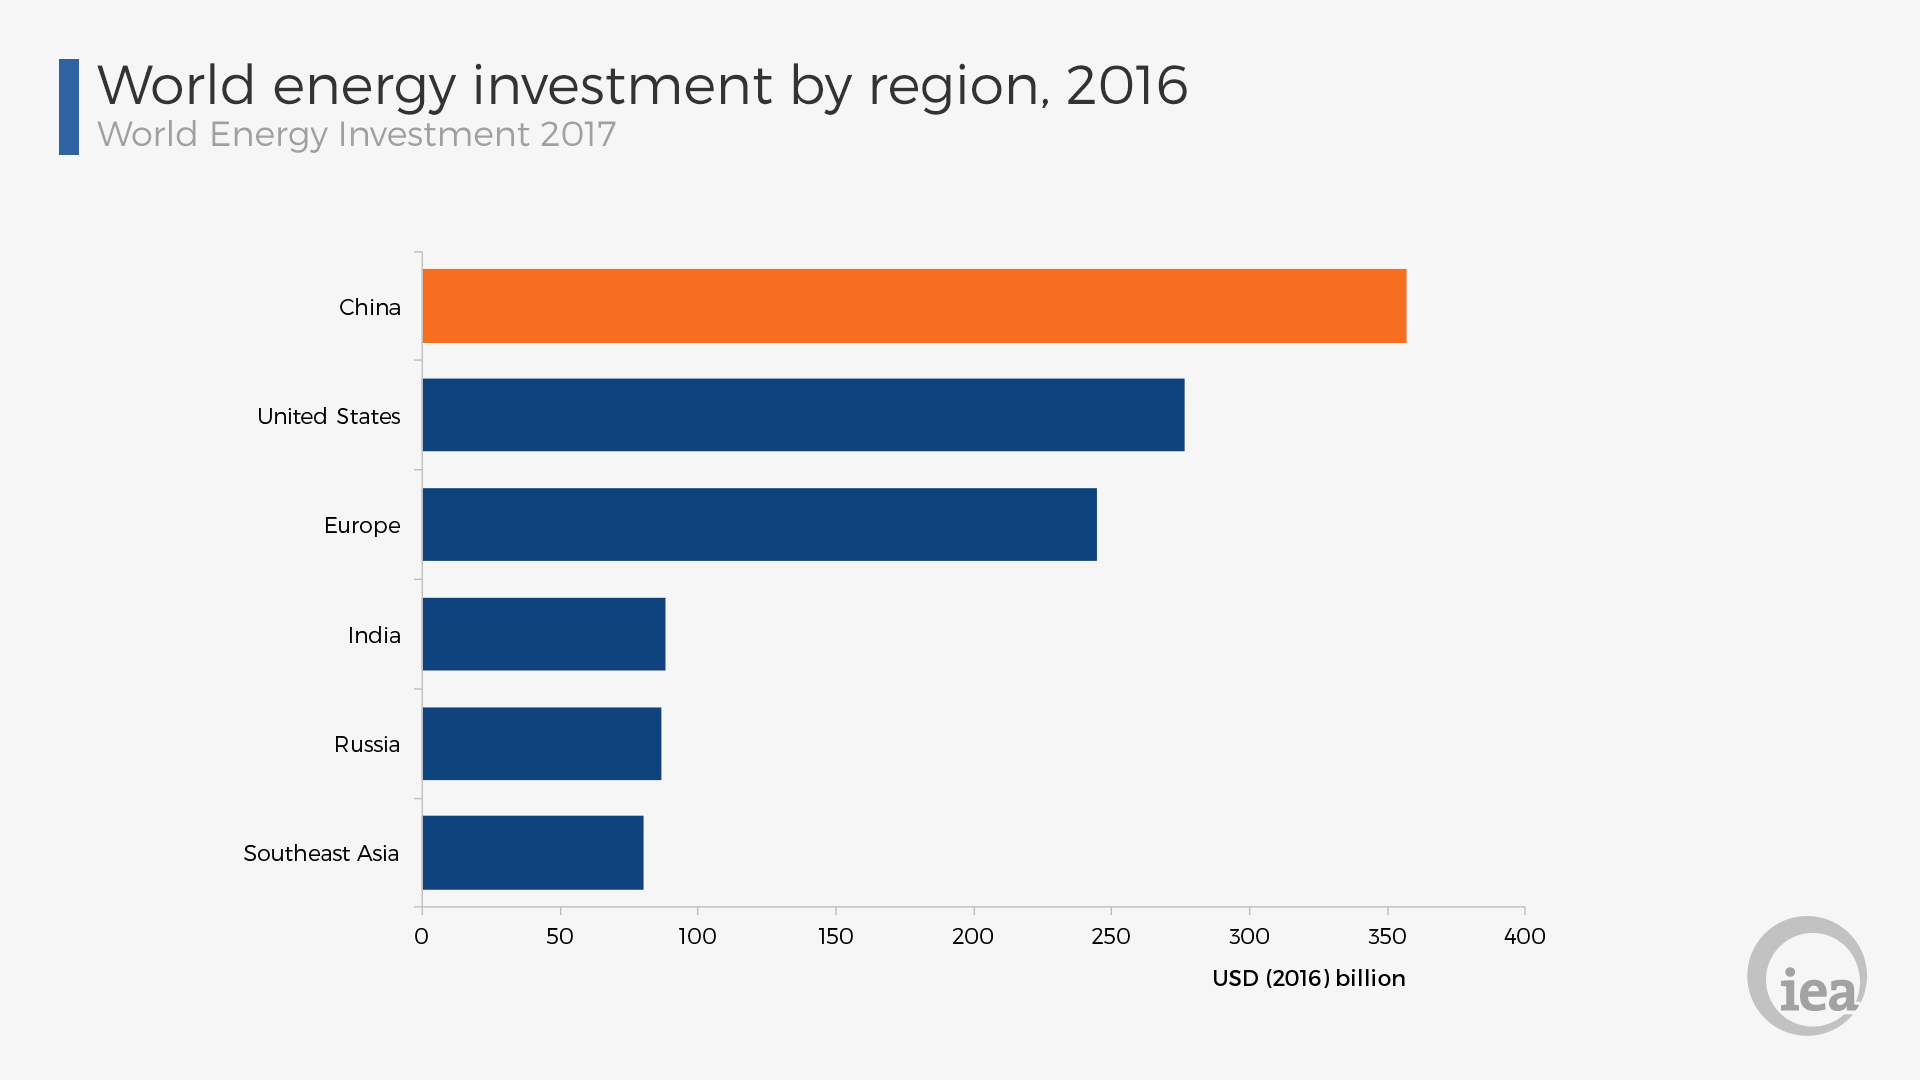
Fig. 2 World energy investment by region, 2016
Energy investment in India jumped 7%, cementing its position as the third-largest country behind the United States, owing to a strong government push to modernise and expand India’s power system and enhance access to electricity supply. The rapidly growing economies of Southeast Asia together represent over 4% of global energy investment.
Despite a sharp decline in oil and gas investment, the share of the United States in global energy investment rose to 16% – still higher than that of Europe, where investment declined 10% – mainly as a result of renewables.
A rebound in upstream investment
After a 44% plunge between 2014 and 2016, it appears that upstream oil and gas investment will rebound modestly in 2017. A 53% upswing in US shale investment and resilient spending in large producing regions like the Middle East and Russia looks to drive upstream investment to bounce back by 3% in 2017 (a 6% increase in nominal terms). Spending is also rising in Mexico following a very successful offshore bid round in 2017.
Fig. 3 Change in upstream oil & gas investment, 2017 vs 2016
There are diverging trends for upstream capital costs: at a global level, costs are expected to decline for a third consecutive year in 2017, driven mainly by deflation in the offshore sector, although with only 3% decline the pace of the plunge has slowed down significantly compared to 2015 and 2016. The rapid ramp up of US shale activities triggers an increase of costs of 16% in 2017 after having almost halved in 2015-16.
The oil and gas industry is undertaking a major transformation in the way it operates, with an increased focus on activities delivering paybacks in a shorter period of time and the sanctioning of simplified and streamlined projects. The global cost curve has rebased, and the significant component of cost reduction experienced over the last two years is likely to persist in the foreseeable future.
Electricity
Increased spending on networks
Global electricity investment edged down by just under 1% to $718 billion, with an increase in spending on networks partially offsetting a drop in power generation. Investment in new renewables-based power capacity, at $297 billion, remained the largest area of electricity spending, despite falling back by 3%. Renewables investment was 3% lower than five years ago, but capacity additions were 50% higher and expected output from this capacity about 35% higher, thanks to declines in unit costs and technology improvements in solar PV and wind.
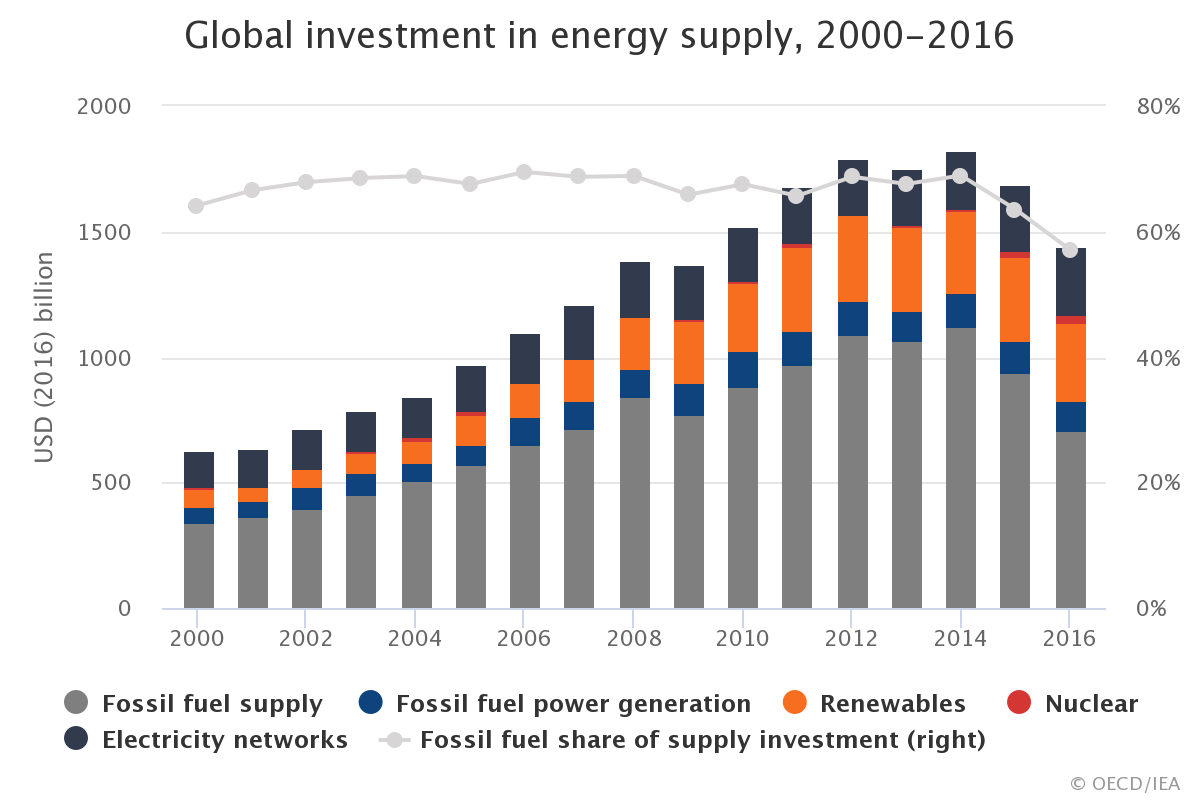
Fig. 4 Global investment in energy supply, 2000-2016
Note: the renewables category in this chart includes investments in electricity, transport and heat
Trends in gas, coal and nuclear power
Investment in coal-fired plants fell sharply, with nearly 20 gigawatts (GW) less commissioned, reflecting concerns about local air pollution and the emergence of overcapacity in some markets, notably China, though investment remained elevated in India. The investment decisions taken in 2016, totalling a mere 40 GW globally, signal a more dramatic slowdown ahead for coal power investment once the current wave of construction comes to an end.
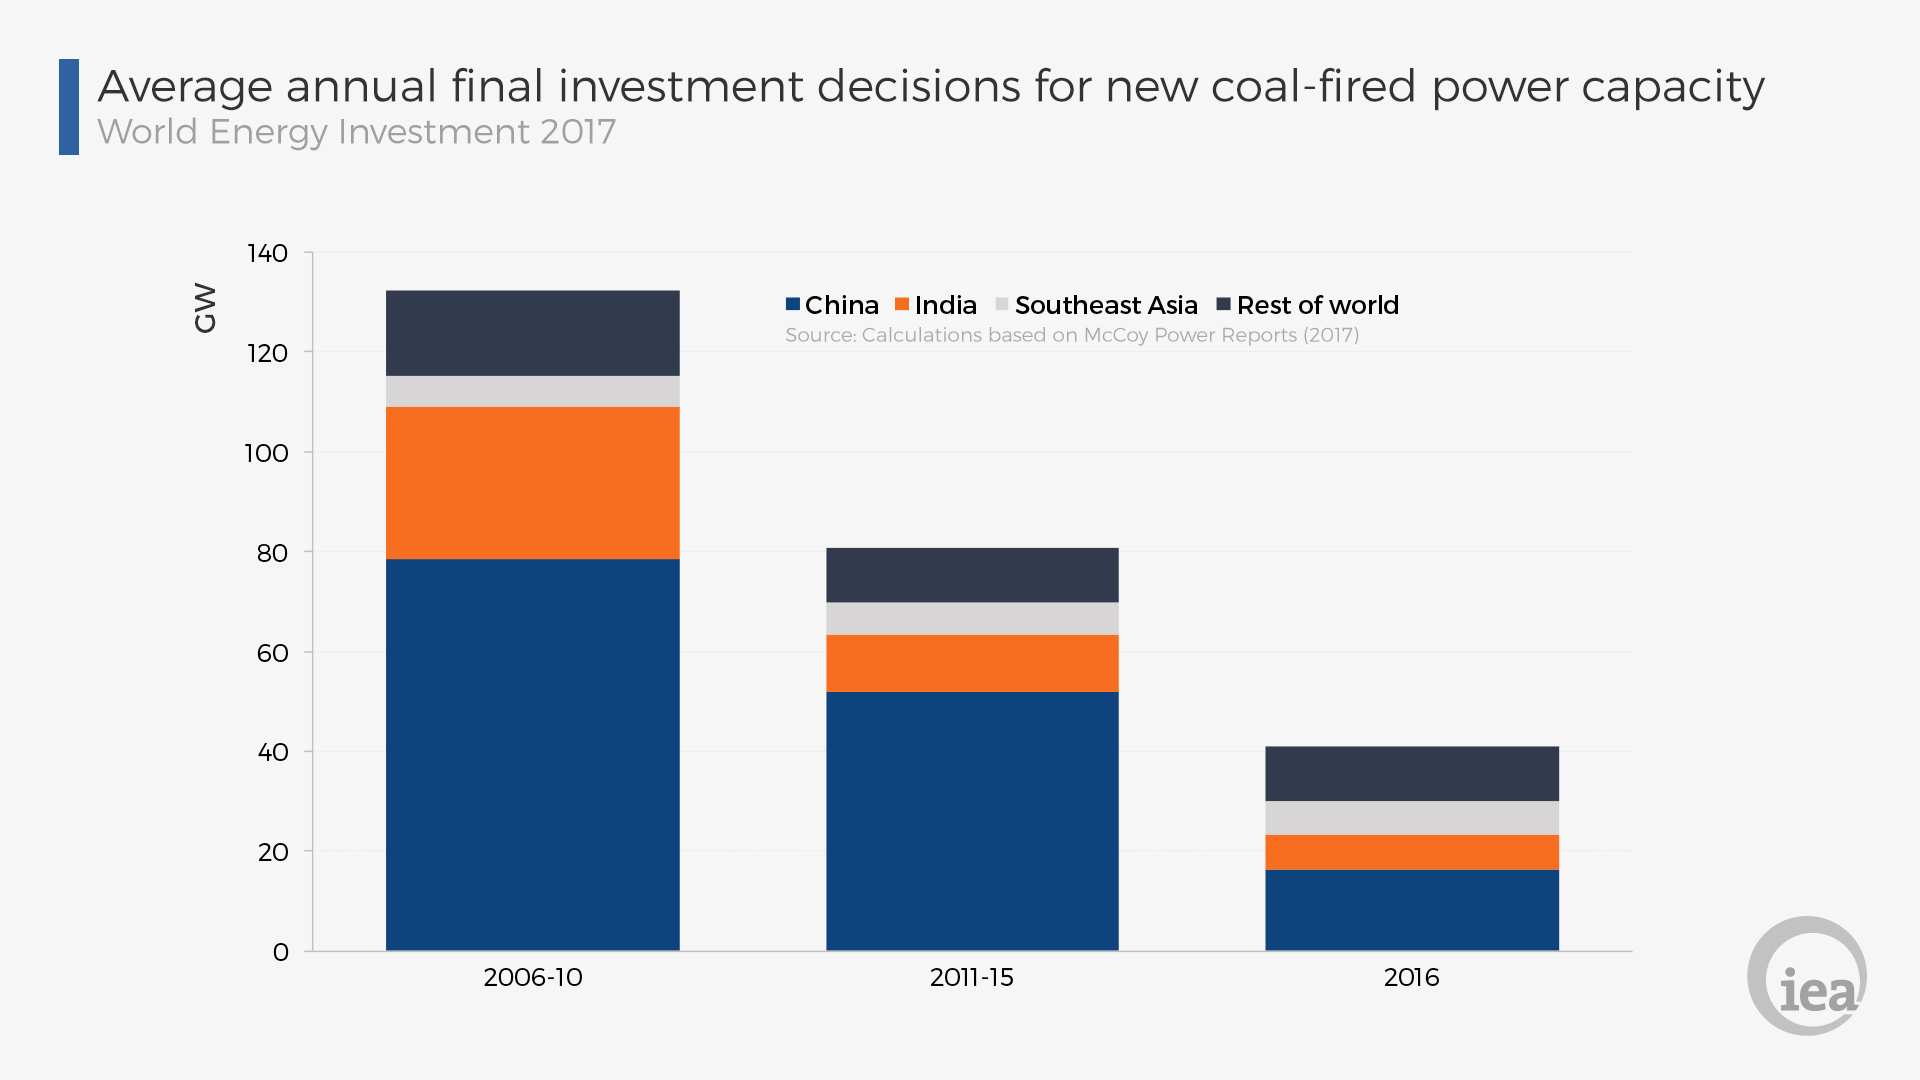
Fig. 5 Average annual final investment decisions for new coal-fired power capacity
Gas-fired power investment remained strong, most of it in North America, the Middle East and North Africa where cheap gas resources are abundant. In Europe, although 4 GW of new capacity came online based on investment decisions made years ago, retirements of gas-power plants exceeded the amount of new capacity that was given the green light for construction.
The 10 GW of nuclear power capacity that came on line in 2016 was the highest in over 15 years, but it results from investment decision taken years ago. In 2016, only 3 GW of nuclear capacity started construction, situated mostly in China, which was 60% lower than the average of the previous decade.
Rising investment in networks and storage
Spending on electricity networks and storage continued its steady rise of the past five years, reaching an all-time high of $277 billion in 2016. China accounted for 30% of networks spending, driven by distribution networks and a significant expansion of large-scale transmission. Another 13% went to India and Southeast Asia, where the grid is expanding rapidly to accommodate growing demand. In the United States (17% of the total) and Europe (15%), a growing share is going to replacement of ageing transmission and distribution assets.
Overall, the grid is modernising and moving from a pure electricity delivery business to an integrated platform for data and services, enabled by rapid progress in digital information and communications technologies, which grew to over 10% of networks spending. Investment in grid-scale battery-based energy storage is ramping up quickly, reaching over $1 billion in 2016.
Second part here.